Dancing Orchards on the I-5
Investigating number-theoretic patterns in large grids of trees
Tuesday, September 10, 2019 · 3 min read
The last time I spent a long time on I-5, I started thinking about envelopes. This time, I started thinking about orchards. As you drive along the central valley highway, you can see thousands and thousands of perfect rows of trees. You can actually see them from the top on Google’s satellite imagery; try zooming in slowly on that point, it’s really quite beautiful.
When you drive by them, you see the side view rather than the top view. In fact, you see the side view in motion – the trees look like they’re dancing an elaborate dance, continuously lining up into different formations to form different rows in different angles. Really, of course, it is you who is moving; the trees are still but by viewing them from different angles you can see different “alignments” of the grid.
The effect is most pronounced with freshly-planted trees (or perhaps those are markers?), where there is no foliage blocking the horizon.

I didn’t think to make a video at the time, but you can imagine that as the car moves forwards a little bit, the pattern re-aligns in an incredibly satisfying way.
I’m intrigued by the multiple “vanishing points” you can see in that picture. The trees are regularly spaced in a square grid, but somehow there are multiple (!) irregularly-spaced (!!) points along the horizon to which rows of trees appear to converge. What’s going on here — is there a pattern to the patterns? You could either stop reading here to have food for thought on your next road trip, or you could keep reading for my ideas.
The I-5 trees are a variation on a well-known theme: a theme called Euclid’s orchard (Wikipedia, MathWorld). You stand at the origin of the plane, and at every integer point there is a line segment (“tree”) extending one unit upwards perpendicular to the plane. What you see from your vantage point is Euclid’s orchard. Try to imagine what it looks like; then, play with a JavaScript simulation of it here.
The main idea of Euclid’s orchard is that trees at integer points (x, y) occlude trees at any integer multiples of that point (nx, ny), so you don’t see anything behind them. Also, nearby trees appear taller than farther-away trees because that’s how perspective works. So there is a “horizon” where in each direction you either see (1) a tree if the direction’s slope is rational, and the tree is shorter if its denominator is larger; (2) nothing if the direction’s slope is irrational. All sorts of fun can be had with this: see for example a nice connection to the Fibonacci numbers.
The I-5 orchard in the picture is similar, but now we look upon it from some height. Imagine mapping each point on the horizon to the direction in which I would have to point my camera to look directly at that point. The “vanishing points” have lots of trees along those directions, giving the illusion of “rows.” What does this mean? It means that if you walked along that ray in Euclid’s orchard, you would run into trees more frequently than other rays. In other words, those rays represent directions whose slopes are rational with small denominators.
Hmm… rational with small denominators… where have I blogged about that before…? Right — around four years ago, when we showed that 2^12864326 begins with the digits “10000000…” (and other number-theoretic shenanigans). I wasn’t kidding, rational approximation really is one of my favorite topics!
At the time I showed you this picture with little explanation.
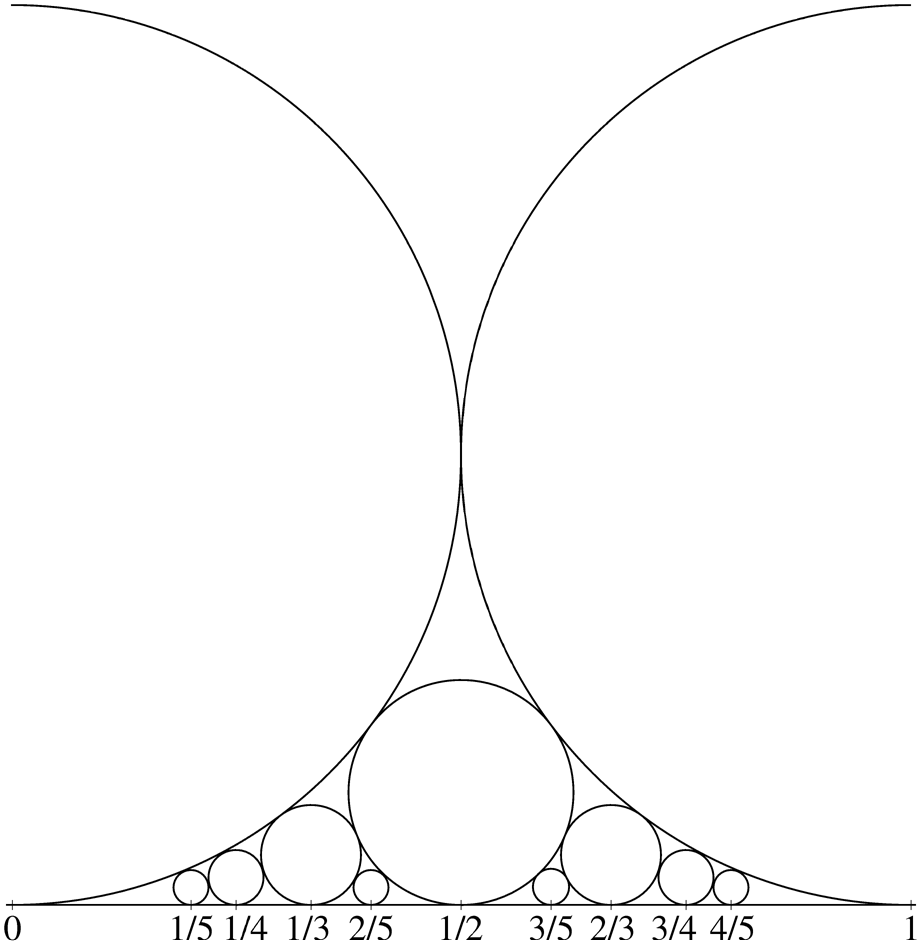
Here is a little more explanation of its significance: as you start filling in circles to some level, you generate a sequence of fractions called the “Farey sequence” by listing the points of tangency of the circle and the X axis. The Farey sequence is the list of completely reduced fractions whose denominators are smaller than some bound. Putting those two facts together: the points of tangency of the circles represent points that are “rational with small denominators” — exactly what we thought our I-9 orchard’s “vanishing points” were!
Looking back at the image, this is somewhat believable. We see a couple of “strong” vanishing points, and then “weaker” vanishing points in between the strong ones, and then even “weaker” vanishing points between the strong and the weak vanishing points, and so on.
There are a number of cool implications of this. For example, the “least patterned” regions of the horizon would correspond to regions that are “hard to rationally approximate”; so, you’d expect them at plus-or-minus the golden ratio’s slope from your line of sight.